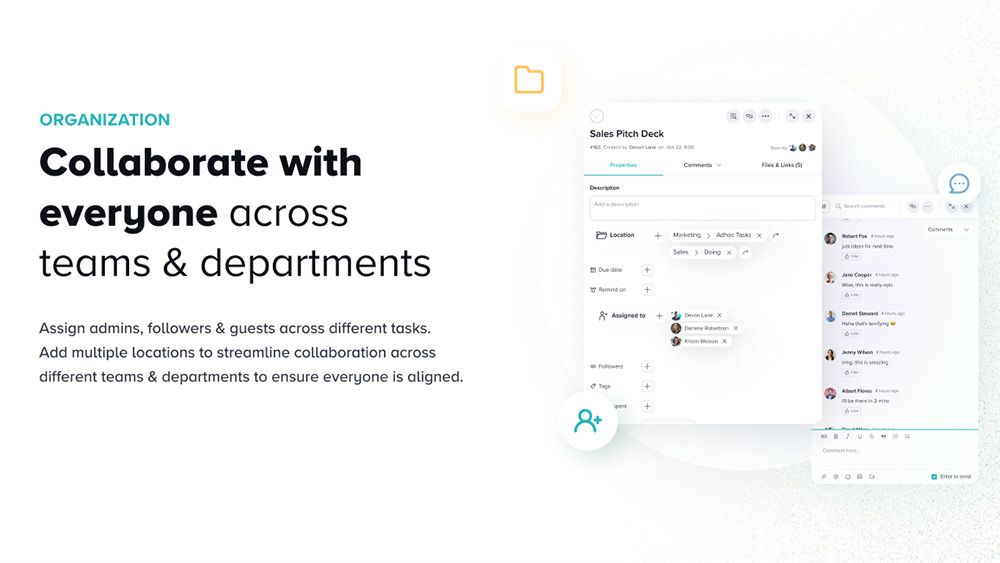
Track your Projects across Teams & Departments
Ever been confused in the workplace? Too much piling on, all at the same time? If the answer is yes to any of those, and you’ve yet to find a solution, you’re in the right place.
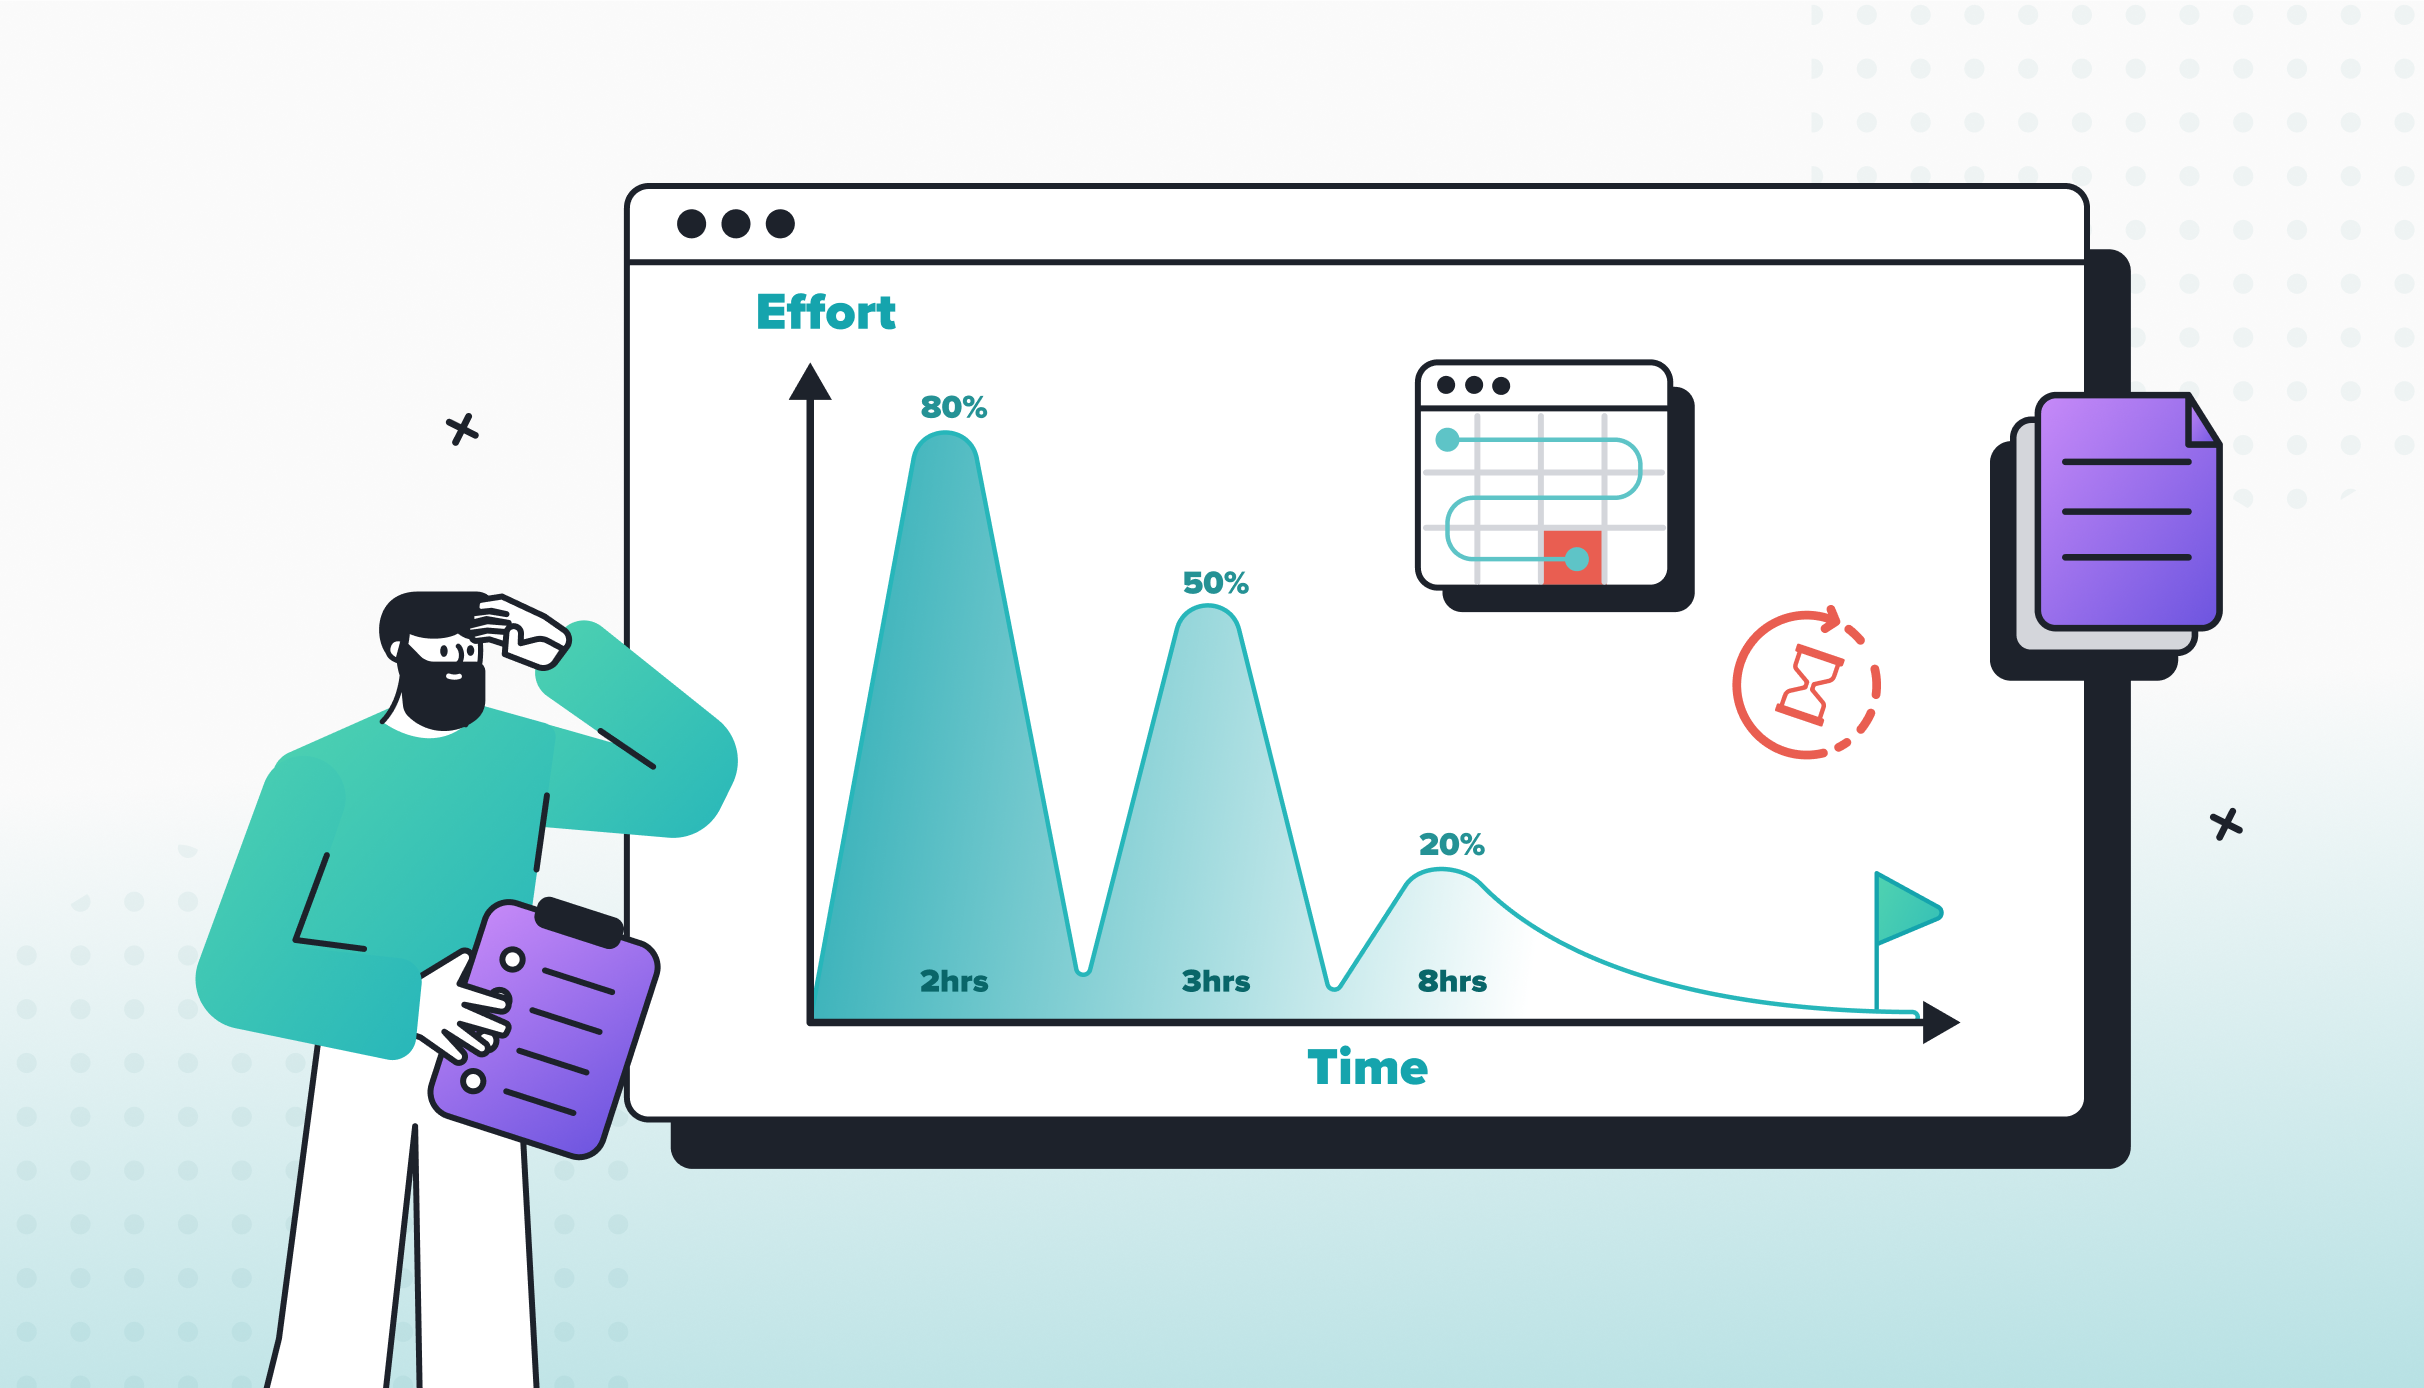
It’s easy to get overwhelmed. With so many projects, so many teams, it’s pretty hard to manage everything, even with a needlessly complicated project management application.
We know this. We’ve felt this situation. That’s why we came up with the solution. A way to not get overwhelmed, a method that keeps you on track, and places you ahead of the game. Welcome to Taskworld.
Multiple Views
If you’re worried that the layout of Taskworld won’t fit what you’re used too, whether you’re coming from another project management application, or you’ve been using other popular applications, like Excel, we’ve got you covered.
There are different views for you to choose from.
-
Board – Like a bulletin board, you can order tasks just like you were putting pins on a board.
-
Table – If you prefer something similar to a spreadsheet, or tables, this is the one for you.
-
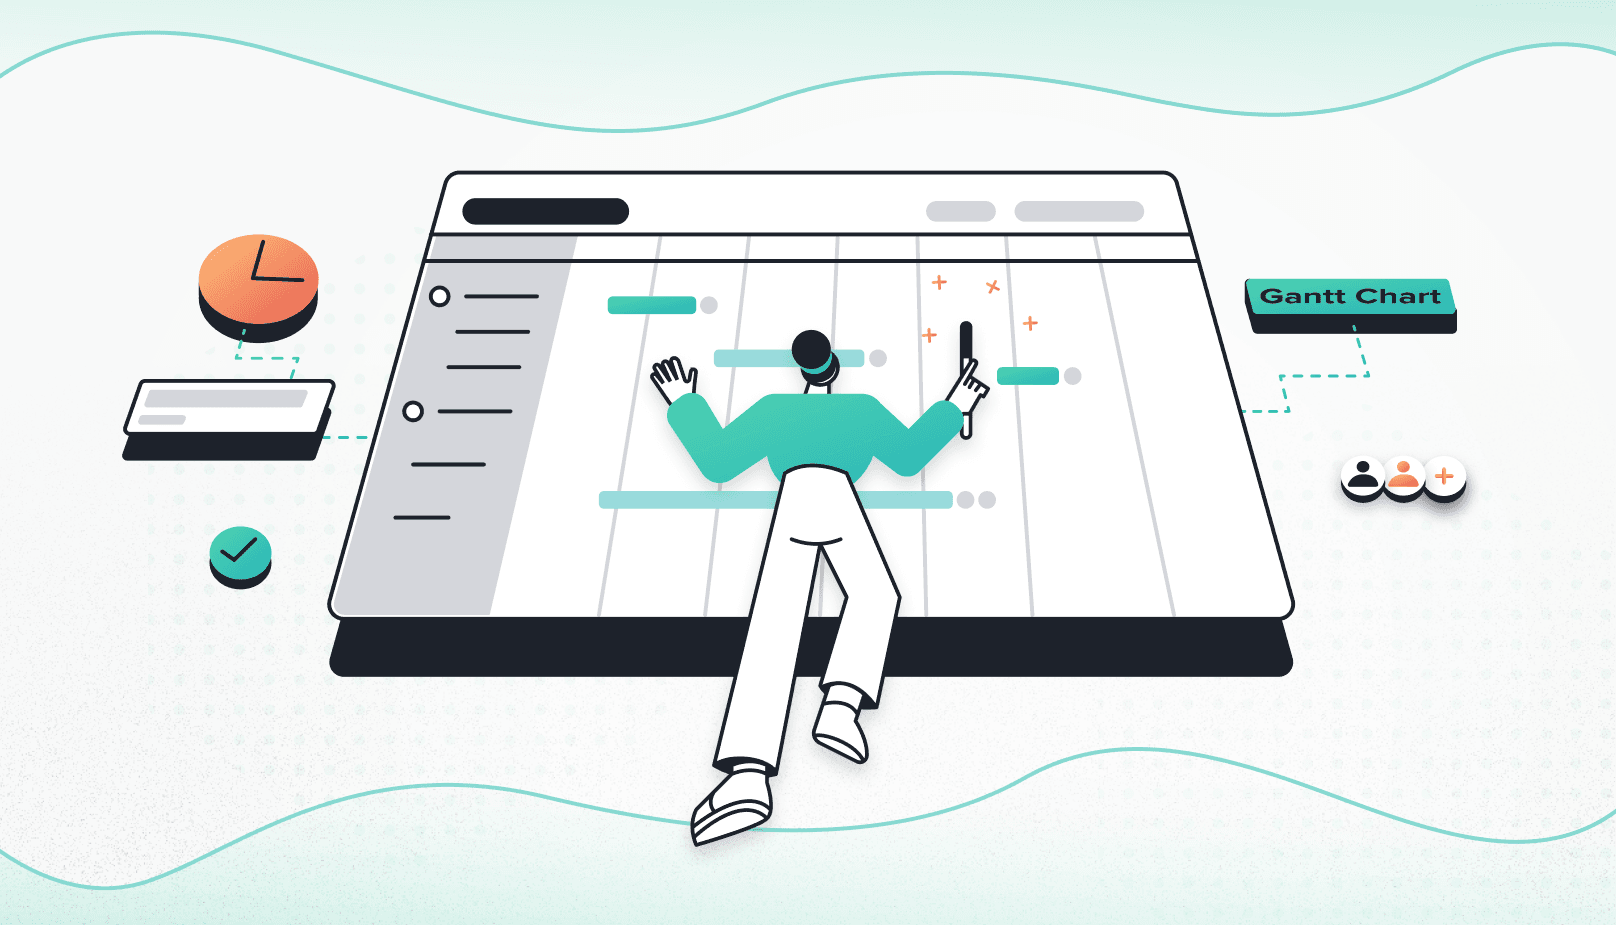
Timeline – If you like dates and deadlines, you’ll feel right at home.
We wanted to make sure that Taskworld is the easiest platform to use.
What’s easier than having the views you’re used too already?
Establishing Priority
So, now that you know we have the board, table, and timeline, available to you, what else is there beyond that?
Even with these choices of UI, things can still get a little hairy, especially if you can’t identify where the priorities lie within the layouts.
That’s why we’ve made it, so you can establish priority.
It’s only natural. The way we’ve made this possible, is through color-coding, and ranking tasks by difficulty.
By establishing a colors & tags, you can let your team know that red means high priority, green means low, and so on. For an extra boost in prioritizing work, you can set a task’s difficulty from 1 to 5, which are represented as dots within the UI.
With these tools, you won’t be able to make it clearer to your team, what needs to be done first, and what they can relax on. For now, of course.
Don’t waste time learning new software. Taskworld is the easiest Project Management Platform available! Get started free No credit card required
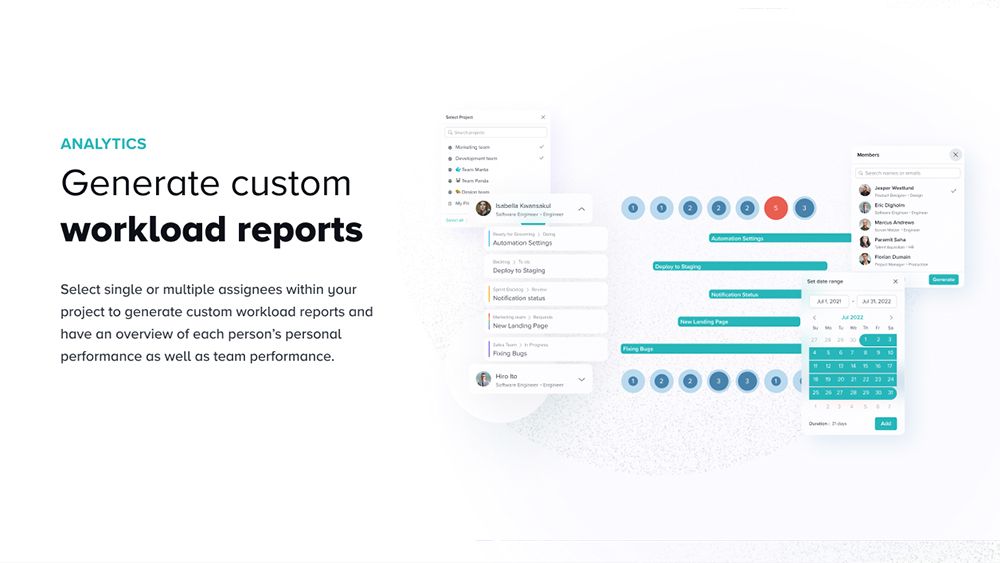
Workload Reports
It’s pretty difficult to assess just how hard of a time your team is having. You can’t dive into their minds, and they may be too prideful to admit that they’re struggling. It’s only human.
So, we made a feature called Workload Reports. There’s a myriad of ways to get the right data you need, to find out who your best performers are, as well as who’s overworking themselves.
You have a choice on how workload distribution is calculated. Here they are:
-
Task Points – All tasks can have points assigned to them. If two people work on a task that has 4 points, with 2 people assigned, and is meant to last for 2 days, the points will be split between the two, and a point will be given each day to them.
-
Number Of Tasks – You can opt to track tasks instead. If a task lasts for more than 1 day, it’ll be counted as 1 day for the assignee. This can add up, giving you a clearer picture of how much they are working.
On that note, the reports will only consider tasks that have both a start date and an end date. The report won’t include tasks that don’t have any or only a due date.
To quickly see if someone is overworked, or they’ve been assigned too many tasks, the blue bubble that indicates assigned tasks or points, will turn red.
With all that in mind, you can generate a report for specific people and project groups. And, as should be expected, you can export to CSV.